How-to: the MariaDB settings that really matter, and how to check them
Skip the hundred-line my.cnf: the ten MariaDB settings that matter, from innodb_buffer_pool_size to durability and connections, and how to check them.
The Internet is full of hundred-line my.cnf files, copied from server to server, where nobody remembers why each line is there. Most of MariaDB’s defaults are sensible; only about ten settings make a real difference. This tutorial goes through them using a real server: MariaDB 12.3 on Rocky Linux, about thirty sites (WordPress, Matomo, Piwigo…), 32 GB of RAM shared with PHP, nginx and other services, spinning disks.
For each setting: what it does, how to choose the value, and above all how to check it’s right. A setting you can’t measure is a setting you shouldn’t touch.
Where the configuration lives, and how to read the real value
MariaDB reads /etc/my.cnf then the files in /etc/my.cnf.d/. Server settings go in a [mariadb] section (read only by MariaDB) or [mysqld] (also read by MySQL-compatible tools). The classic trap: the same variable defined in two files, the last one read wins. Two commands tell the truth:
mariadbd --print-defaults          # what the server will read at next start
mariadb -e "SHOW GLOBAL VARIABLES LIKE 'innodb_buffer_pool_size'"   # the current value
A misspelt variable in the file is ignored with a mere warning in the error log. Always compare the current value with the one you think you set.
The whole file
[mariadb]
# --- Memory -------------------------------------------------------------
innodb_buffer_pool_size        = 12G
innodb_log_file_size           = 2G
innodb_log_buffer_size         = 256M
tmp_table_size                 = 256M
max_heap_table_size            = 256M

# --- Durability ----------------------------------------------------------
innodb_flush_log_at_trx_commit = 1
sync_binlog                    = 1
innodb_flush_method            = O_DIRECT

# --- I/O (spinning disks) ----------------------------------
innodb_io_capacity             = 200
innodb_io_capacity_max         = 400

# --- Connexions ----------------------------------------------------------
max_connections                = 400
thread_cache_size              = 64
wait_timeout                   = 28800

# --- Tables et fichiers --------------------------------------------------
table_open_cache               = 4096
table_open_cache_instances     = 8
table_definition_cache         = 4096
open_files_limit               = 68000

# --- Binlogs, replication ------------------------------------------------
server_id                      = 10
log_bin                        = /data/mysql/binlogs/logbin
binlog_format                  = ROW
binlog_expire_logs_seconds     = 432000
max_binlog_size                = 512M
log_slave_updates              = ON

# --- Hygiene -------------------------------------------------------------
character_set_server           = utf8mb4
collation_server               = utf8mb4_uca1400_ai_ci
transaction_isolation          = READ-COMMITTED
skip_name_resolve              = ON
local_infile                   = OFF
max_allowed_packet             = 256M
slow_query_log                 = ON
long_query_time                = 5
log_slow_verbosity             = query_plan,explain
Memory
innodb_buffer_pool_size, the setting that matters most
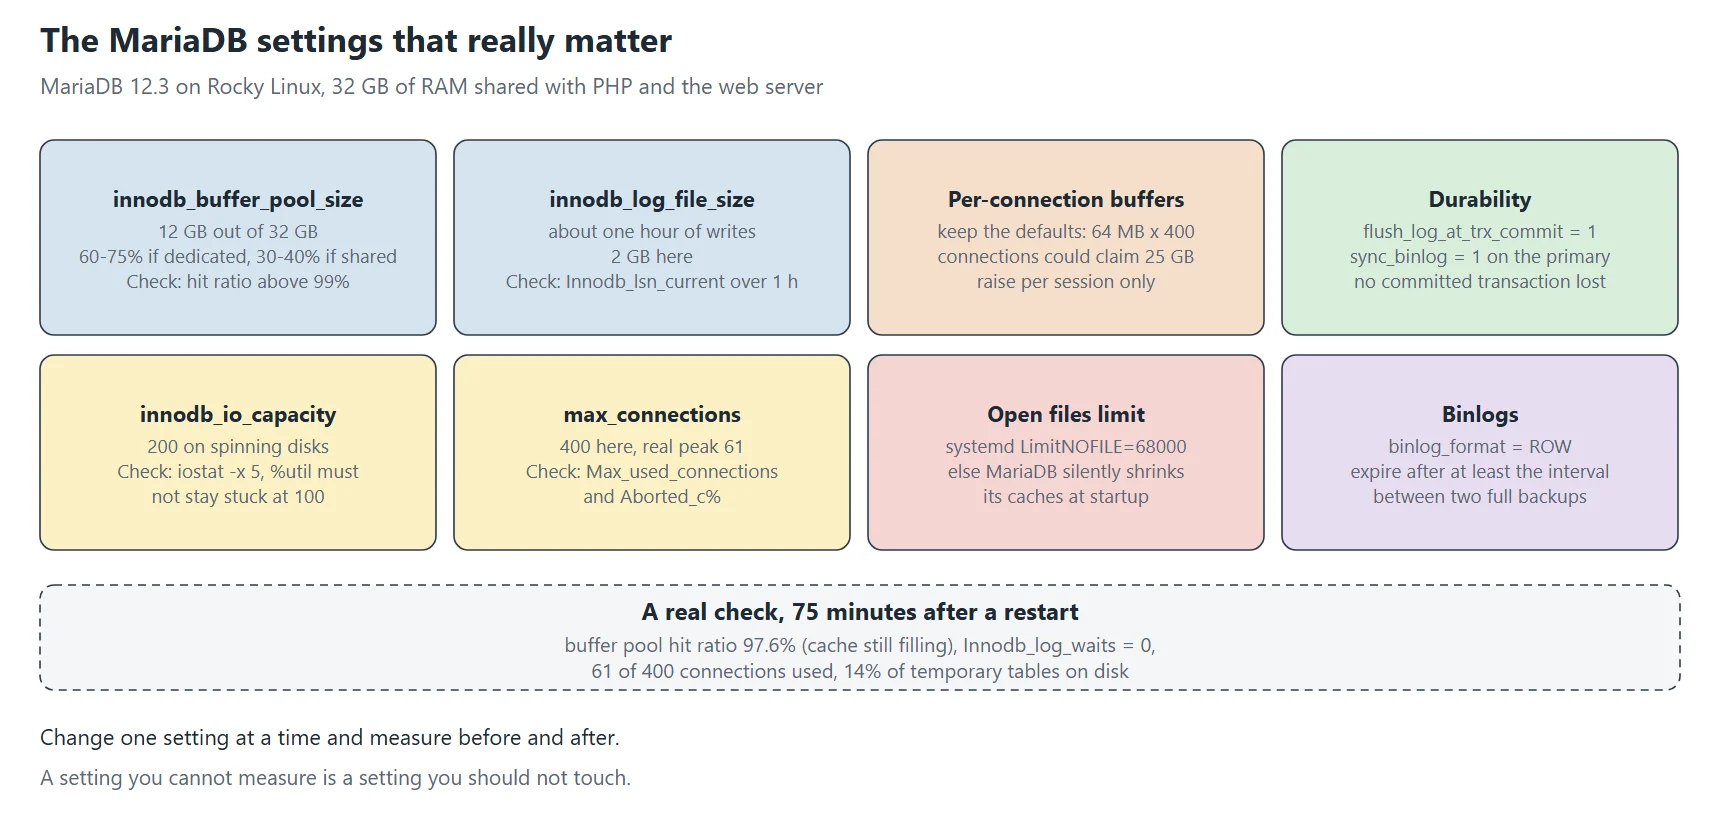
It’s the cache where InnoDB keeps table and index pages. As long as the data actually used fits, reads don’t touch the disk, which is often a factor of a hundred in response time. The usual rule: 60 to 75% of RAM on a server dedicated to the database, 30 to 40% on a server that also runs the application and the web server. Here, 12 GB out of 32.
To know whether it’s enough, measure the share of reads served by the cache:
SELECT ROUND(100 * (1 - r.v / q.v), 2) AS hit_ratio_pct
FROM (SELECT VARIABLE_VALUE v FROM information_schema.GLOBAL_STATUS
      WHERE VARIABLE_NAME = 'Innodb_buffer_pool_reads') r,
     (SELECT VARIABLE_VALUE v FROM information_schema.GLOBAL_STATUS
      WHERE VARIABLE_NAME = 'Innodb_buffer_pool_read_requests') q;
Above 99% over a normal day, memory isn’t your problem. Below 95%, every query that touches cold data reads the disk: grow the cache if RAM allows, or look for queries that scan whole tables. Since MariaDB 10.5 there’s no need to split the cache into innodb_buffer_pool_instances: it’s handled internally.
innodb_log_file_size: sizing the redo log
Every change is first written to the redo log, then the modified pages are written to the data files in the background. A redo log that’s too small forces InnoDB to flush pages in a hurry when it fills up, which causes latency spikes. A good size covers about an hour of writes. Measure it:
SELECT VARIABLE_VALUE INTO @a FROM information_schema.GLOBAL_STATUS WHERE VARIABLE_NAME='Innodb_lsn_current';
SELECT SLEEP(3600);
SELECT VARIABLE_VALUE INTO @b FROM information_schema.GLOBAL_STATUS WHERE VARIABLE_NAME='Innodb_lsn_current';
SELECT ROUND((@b - @a) / 1024 / 1024) AS redo_mb_per_hour;
If the result is 400 MB per hour, a 512 MB to 1 GB log is enough; here 2 GB leaves room for imports. A bigger log only lengthens crash recovery, from seconds to a few minutes.
Per-connection memory: the multiplication trap
sort_buffer_size, join_buffer_size, read_buffer_size, read_rnd_buffer_size are allocated per connection, sometimes several times per query. A 64 MB join_buffer_size looks harmless, but multiplied by 400 connections it could in theory claim 25 GB. Keep the defaults unless a measurement says otherwise, and raise them only for one session (SET SESSION) during a heavy job.
tmp_table_size and max_heap_table_size go together: the smaller of the two sets the maximum size of an in-memory temporary table before it moves to disk. Watch the ratio of Created_tmp_disk_tables to Created_tmp_tables: above 10 to 20%, some queries sort or group large volumes.
Durability
innodb_flush_log_at_trx_commit = 1 writes and syncs the redo log at every commit; sync_binlog = 1 does the same for the binlog. Together they guarantee that a power cut loses no committed transaction and that the replica stays consistent with the primary. Values 2 or 0 reduce synchronous writes, at the cost of up to one second of lost transactions if the system crashes: acceptable on a replica you can rebuild, never on the primary.
innodb_flush_method = O_DIRECT makes InnoDB write straight to disk without going through the system cache: data isn’t cached twice (in InnoDB’s cache and in the kernel’s). It’s the default in recent versions; check it rather than assume it.
I/O
innodb_io_capacity tells InnoDB how many operations per second the storage can absorb for background work (page flushing, purge). The default suits SSDs. On spinning disks, 200 keeps InnoDB from saturating the disk at the expense of queries; innodb_io_capacity_max sets the ceiling when it falls behind. To check: iostat -x 5 during a busy period; the %util column must not stay stuck at 100.
Connections
max_connections should cover the sum of connections the applications can open, with a margin, no more: each connection uses memory, and raising this limit to “fix” Too many connections errors often hides an application that doesn’t close its connections. Look at the real peak:
SHOW GLOBAL STATUS LIKE 'Max_used_connections';
SHOW GLOBAL STATUS LIKE 'Aborted_c%';
SHOW GLOBAL STATUS LIKE 'Threads_created';
thread_cache_size keeps threads ready for reuse: if Threads_created grows quickly, raise it. wait_timeout closes idle connections; 8 hours suits web applications, which reconnect on their own.
Tables and files
table_open_cache keeps tables open between queries; it’s split into table_open_cache_instances to limit contention between threads. If Opened_tables keeps growing, the cache is too small.
The trap that cost me time: this cache depends on how many files the process may open. MariaDB computes its limits from open_files_limit, but systemd imposes its own (LimitNOFILE). If systemd’s is lower, MariaDB silently shrinks its caches at startup: I found a server set to 8 instances that was only using 3. The fix is a systemd override file:
# /etc/systemd/system/mariadb.service.d/limits.conf
[Service]
LimitNOFILE=68000
systemctl daemon-reload && systemctl restart mariadb
mariadb -e "SHOW GLOBAL VARIABLES WHERE Variable_name IN ('open_files_limit','table_open_cache_instances')"Binlogs and replication
The binlog records every change; it serves replication and point-in-time recovery. binlog_format = ROW records the changed rows rather than the statements: bigger, but unambiguous (a statement with NOW() or RAND() doesn’t give the same result replayed elsewhere). binlog_expire_logs_seconds purges old files: keep at least the interval between two full backups, or point-in-time recovery becomes impossible for the period in between. server_id must be unique across the whole replication topology, and log_slave_updates lets a replica act as a source itself.
Hygiene
- utf8mb4: real 4-byte UTF-8, emoji included. The historical
utf8set is limited to 3 bytes and truncates some characters; - collation_server: recent versions offer UCA 14.0 collations (
utf8mb4_uca1400_ai_ci), more accurate for comparisons and sorting; - READ-COMMITTED: fewer locks than the default REPEATABLE-READ, a good fit for web applications;
- skip_name_resolve: no DNS lookup on every connection (slow DNS would mean slow connections), and grants are given by IP address;
- local_infile = OFF: closes a door that lets a client make the server read files;
- max_allowed_packet: the maximum size of a query or a row; too small, and imports and large contents fail;
- the slow query log: beyond 5 seconds, with the execution plan. Read it every week: it’s the best optimisation source there is.
The method
- change one setting at a time, and note the measurement before and after;
- many variables can be changed live (
SET GLOBAL) for a trial; then write them to the file, or they vanish at restart; - those that need a restart (redo log size,
open_files_limit) get scheduled; - keep the configuration under version control, with the reason for each non-default value as a comment. In six months, that comment will be worth more than the value itself.
Checks after a change
systemctl restart mariadb && systemctl is-active mariadb
journalctl -u mariadb -n 30 --no-pager | grep -iE 'warn|error'
mariadb -e "SHOW GLOBAL VARIABLES" > /tmp/vars.after
diff <(sort /tmp/vars.before) <(sort /tmp/vars.after)
If a Prometheus exporter watches the database, compare over a few days the cache hit ratio, on-disk temporary tables, connections and query latency. A setting is only good if those curves confirm it.
A real check, 75 minutes after a restart
To show what these checks give on a real server, here is my web server’s MariaDB 12.3 on 2 November 2026, read with the monitoring account (which only needs to read variables and counters). The machine had rebooted 75 minutes earlier, which makes the numbers more instructive, not less.
SELECT @@innodb_buffer_pool_size/1024/1024/1024 AS buffer_pool_gb,
       @@innodb_log_file_size/1024/1024        AS redo_mb,
       @@max_connections, @@innodb_flush_log_at_trx_commit, @@sync_binlog;
+----------------+---------+-------------------+---------------------------------+---------------+
| buffer_pool_gb | redo_mb | @@max_connections | @@innodb_flush_log_at_trx_commit| @@sync_binlog |
+----------------+---------+-------------------+---------------------------------+---------------+
|  12.31         | 2048    |               400 |                               1 |             1 |
+----------------+---------+-------------------+---------------------------------+---------------+

SHOW GLOBAL STATUS WHERE Variable_name IN (...);
| Uptime                           | 4487     |
| Innodb_buffer_pool_read_requests | 5163358  |
| Innodb_buffer_pool_reads         | 121600   |
| Innodb_log_waits                 | 0        |
| Max_used_connections             | 61       |
| Threads_created                  | 61       |
| Connections                      | 11846    |
| Created_tmp_tables               | 37637    |
| Created_tmp_disk_tables          | 5223     |
How I read it, line by line:
- Buffer pool hit ratio: 1 − 121 600 / 5 163 358 = 97.6 %. On a server that has been up for weeks I expect above 99.9 %. Here the cache is still filling: every page read from disk since the restart counts as a miss. That’s why the ratio must be compared over days, never right after a restart, and why a restart is followed by a slow first hour.
- Innodb_log_waits = 0: no transaction had to wait for room in the log buffer. With a 2 GB redo log, even the start-up traffic didn’t saturate it.
- Max_used_connections = 61 out of 400 allowed, and Threads_created = 61 for 11 846 connections: the thread cache reuses threads instead of creating one per connection. If Threads_created grew almost as fast as Connections, thread_cache_size would be too small.
- Temporary tables on disk: 5 223 out of 37 637, i.e. 14 %. That’s mostly WordPress queries sorting text columns, which go to disk regardless of tmp_table_size. Above 25 %, it’s worth looking for the queries responsible before raising any limit.
- innodb_flush_log_at_trx_commit = 1 and sync_binlog = 1: full durability on the primary. The replica runs with 2 and 0, the reasons are in the MariaDB series.
Total time: two queries, one minute. Run them before and after every change, and keep the outputs: that’s what turns “it feels faster” into a measurement.
This post is part of a series of sysadmin tutorials (tag “how-to”).
Series “How-to”, tutorial 6/77. · ← Previous tutorial · Next tutorial → · Version française
2 Comments